
PerformanceVP / Offerings / PerformanceVP Portal
Measure every unit's performance, and see what to fix first.
The PerformanceVP Portal puts our model in your hands. Your team runs the measurement online, and the Portal shows each unit's performance, what is constraining it, and where a change could do the most.
Performance moves. A reorganisation, a new leader, a change you have just made: each shifts things beneath the surface. The Portal makes measurement a routine. Your administrators set up the organisation, launch each campaign and release the results, and the Portal scores every campaign when it closes.
What it measures
The four forces, and seventeen measures beneath them, for every unit.
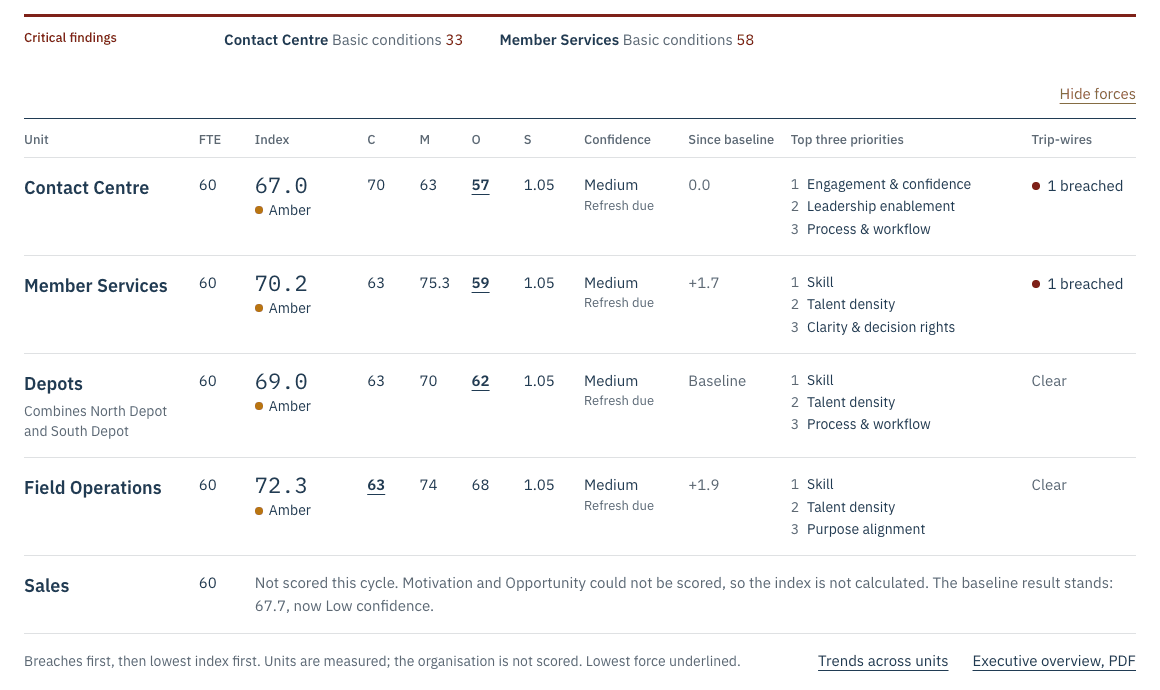
Each unit gets its own reading of Capability, Motivation, Opportunity and Synergy, built from seventeen measures, with trip-wires for pay equity, fairness and basic conditions reported ahead of every score.
Capability
Can the unit do the work? The skills, knowledge and shared know-how the work needs, and how quickly the unit learns.
Motivation
Is the unit willing to do the work? Whether people care about the outcome, feel safe to speak up and see why their work matters.
Opportunity
Does the system allow it? Clear decision rights, the right tools and information, workable processes, enough capacity and leaders who enable.
Synergy
Does the unit multiply or drag? How well people work together. Synergy lifts or holds back the whole result.
Every number explains itself
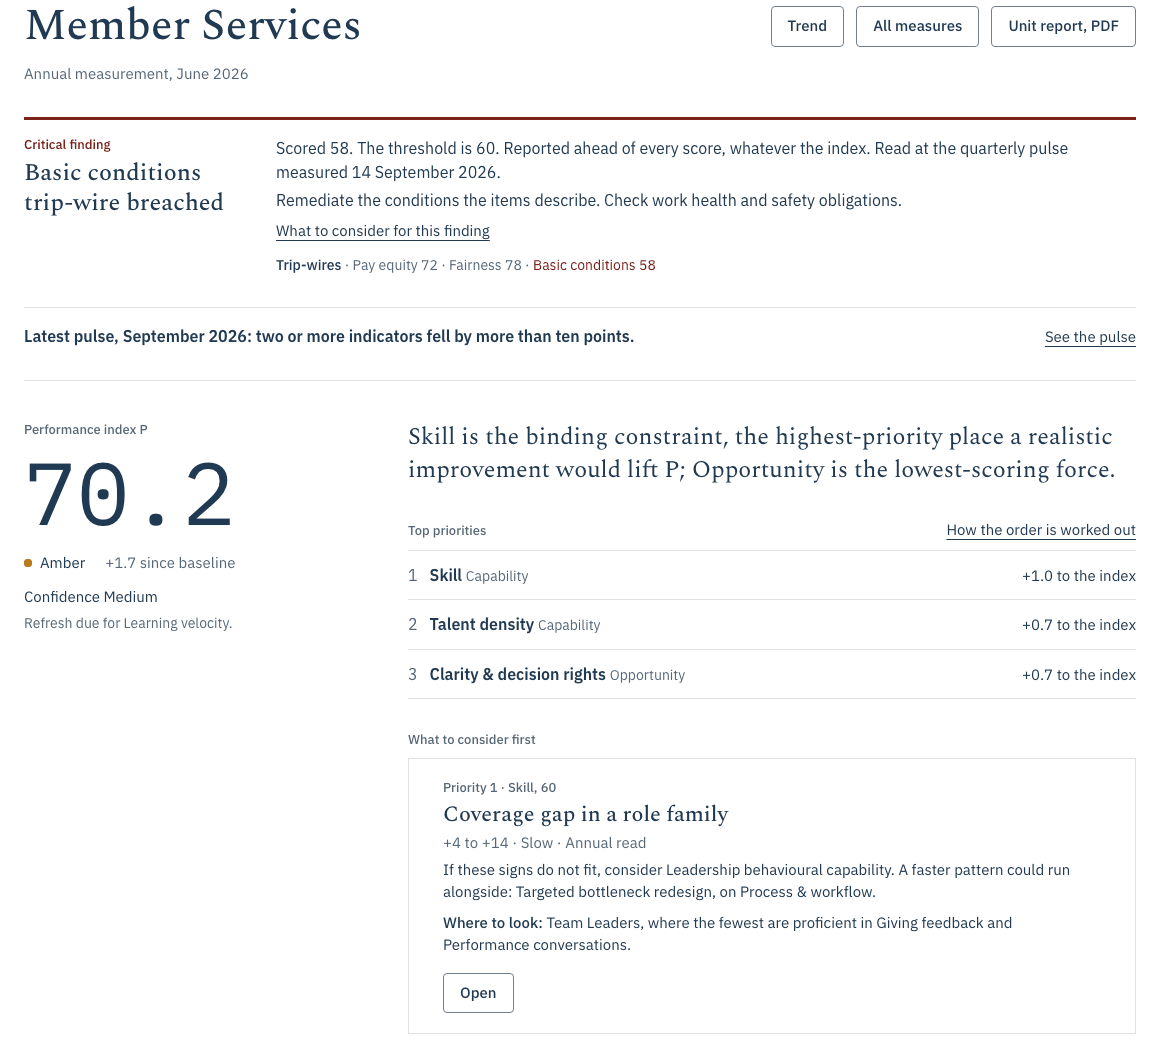
Each unit's results open with its performance index on a scale of 0 to 100 and its binding constraint. Every measure shows its confidence and the month it was measured, and anything without enough data says so, with the reason, rather than showing a zero.
How it works
From your directory to results, run by your own team.
Setup is quick and intuitive, saves as you go, and asks little of your team. After that, each campaign largely runs itself between launch and close.
Upload your directory
Download the template, fill it from your HR system and upload it. The Portal shows every joiner, leaver and move before anything changes, and nothing applies until you confirm. A unit needs ten people or more to be measured; a smaller one is combined with a unit in its branch.
Set each unit's context
Start from the template library, ordered by your sector, for role families and skills, then name each unit's knowledge domains, decision types, critical processes and systems. You edit a starting point rather than writing from scratch, and the questions, scales and scoring stay fixed.
Launch a campaign
Once the readiness check passes, launch. Members answer a short anonymous survey on a phone or computer, managers rate their own direct reports, team leaders and the leadership team answer brief modules, and your administrators complete short checklists. Reminders go out automatically.
Review and release
When a campaign closes, the Portal scores every unit and holds the results for your review. Nothing reaches your executives or unit leaders until an administrator releases it.
Read the results
Each unit opens with its performance index, its binding constraint and its top priorities, each with recommended next steps. Trip-wires come first, and every number can show where it came from.
Take it into the room
Download a unit report for a run-through with a unit's leaders, and an executive overview for the executive team, over the units you choose. Both are PDFs, generated when you ask for them.
The results
The answer first, and the detail one click away.
Each unit's page answers the question on its first screen: whether a trip-wire has fired, the performance index and its confidence, the binding constraint, and what to consider first. Everything behind it, from each force to each measure and its trend, is a click away.
For the meeting
Two reports, written for the people who act on them.
- Unit reportFor a run-through with a unit's leaders: the index, the binding constraint and every priority, a section per force, what to consider and the trend, with an optional methodology appendix.
- Executive overviewFor the executive team, over the units you choose: the critical findings, how each unit has moved, and half a page per unit with its top three recommendations.
- Scores, CSVFor administrators: the released scores for each measure, per unit and per cycle.
The rhythm
Four campaigns a year, and a fresh measurement when something changes.
Your first campaign is a baseline, the full measurement. After it, each year holds four campaigns, so the picture stays current without asking too much of your people.
Pulse
A short check on a few fast-moving indicators. It shows which way things are heading and flags a fall, without recalculating the index.
Half-yearly
Part of the survey, and the capacity facts, measured again. The index is recalculated, and anything not measured carries forward with its date.
Pulse
A second pulse on the same indicators, so the direction of travel is read every quarter.
Annual
The full measurement again, across all four forces and every measure. A fresh baseline for the year ahead.
And when something changes
The Portal watches for change. When a unit's headcount moves by more than a fifth, a team turns over, a unit gets a new leader or a pulse falls, it prompts a fresh measurement of just what the change affects. Your administrators run it, defer it or dismiss it, and there is no limit on how many you run.
Anonymity and privacy
Anonymous where it should be, and clear about what is not.
Survey answers are anonymous. Each person's link works once, and their answers are stored without their name, email address or any other identifier. No one can read an individual's answers, PerformanceVP included.
Results are shown only for groups large enough to protect the people in them. A unit needs ten people or more to be measured, and a survey result appears only when at least five people have answered, or eight for the most sensitive measures. The database enforces this, not the screen.
Manager ratings are different, and the Portal says so wherever the two could be confused. Managers rate their own direct reports by name. Those ratings are visible to your administrators, never to executive or unit viewers, and every time an administrator views them is logged.
PerformanceVP staff reach your data only through a support session opened with a written reason, which your administrators can always see. The Portal's Privacy Notice sets out the detail.
The next step
When a finding needs designing, ask us from inside the Portal.
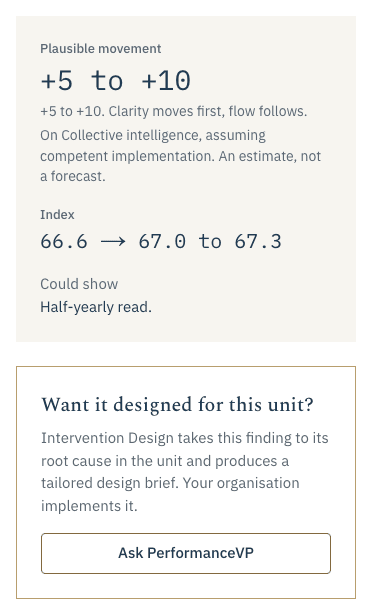
Every suggestion in the Portal carries the same offer: Ask PerformanceVP for a tailored brief. Intervention Design takes the finding to its root cause in the unit and produces a design your organisation implements, with success criteria and a way to measure the effect.
We design and measure; your teams implement. Later campaigns show how the measure moves.
Pricing
Priced in tiers, so it stays within reach.
The Portal is an annual subscription, priced in tiers by the number of people in scope, so it suits a single business unit as well as a whole organisation. Every tier includes every campaign in the rhythm, fresh measurements without limit, and both reports. Tell us about your organisation and we will confirm the tier that fits.
Three ways to engage
Where the Portal sits
PerformanceVP Portal
Measure every unit yourself, online, and see what to fix first.
The Diagnostic
The same measurement, delivered by us, with an analyst in the room.
03Intervention Design
Design the highest-return changes either route identifies, ready to act on.
Keep performance in view.
Tell us about your organisation and the units you want to measure. We will follow up to talk it through, with no obligation.
Contact us →